Filtrer les publications
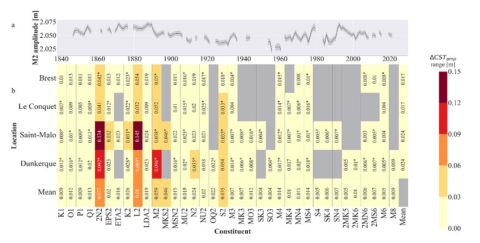
Drivers of tidal characteristic changes in north western France: a statistical analysis
Tides are changing on human timescales, and an understanding of reasons for these changes is important for inundation risk assessments and coastal defence planning. Tides are often regarded as astronomically generated phenomena, however recently published literature has investigated changes in tidal characteristics driven by non-astronomical factors.
J. Challis, D. Idier, G. Wöppelmann, G. André, R. Legouge, J. Rohmer
Date de sortie 2022
Date de sortie 2022
Paralia - XVIIèmes Journées Nationales Génie Côtier – Génie Civil, Chatou
Etude de l'impact d'une tempête extrême sur la Grande Plage de Biarritz en présence d'une digue amovible en sacs de sable
La Grande Plage de Biarritz a connu plusieurs événements de tempêtes extrêmes ces dernières décennies qui ont causé d’importants dégâts matériels sur les ouvrages et bâtiments situés en front de mer. Ces événements ont conduit à la mise en place d’une stratégie de protection des infrastructures et des usagers qui intègre notamment le déploiement d’une digue amovible en sacs de sable sur le perré situé en haut de plage.
M. Rozki, D. Morichon, M. Delpey, V. Roeber, S. Abadie
Date de sortie 2022
Date de sortie 2022
Paralia - XVIIèmes Journées Nationales Génie Côtier – Génie Civil, Chatou
Seiches à l’échelle de baies : origines et identification des périodes propres d’oscillations à partir des données d’observations sur le long terme en Provence à partir du réseau HTM-NET
L’étude présentée sur les oscillations résonantes dans des bassins semi-ouverts de la côte provençale est basée sur l’analyse des données de niveaux issus de stations du réseau d’observation HTM-NET, composées de deux capteurs piézométriques, l’un immergé et l’autre émergé, permettant de connaitre la pression atmosphérique, le niveau d’eau et la température avec une période d’échantillonnage de 2 min. Elle concerne les baies de La Ciotat, de Sanary, la Rade de Toulon (grande et petite rades), le Golfe de Giens et la Rade d’Hyères.
V. Rey , C. Paugam, C. Dufresne, D. Mallarino, T. Missamou, J.-L. Fuda
Date de sortie 2022
Date de sortie 2022
Paralia - XVIIèmes Journées Nationales Génie Côtier – Génie Civil, Chatou
Seasonal runup variability at a reef-lined beach: field assessments in the Caribbean
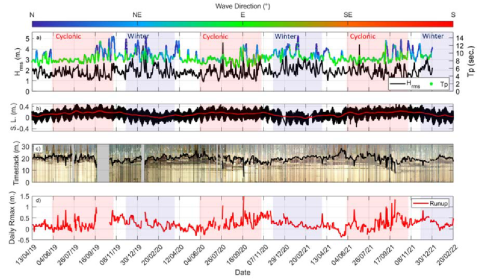
The proposed article deals with the assessment of coral reef impact on runup-induced coastal flooding over a two years and 10 months period at Anse Maurice, a reef-fringed pocket beach located at Guadeloupe Island, in the Caribbean region. The reef is mainly constituted by complex structures of Acropora Palmata dead colonies. Daily maximum marine inundation was assessed using a fixed video system. Daily Highest Runups (DHR) remains primarily correlated to individual storm event as extreme runups are observed in correlation with storm swells.
T. Laigre, Y. Balouin, A. Nicolae-Lerma, N. Valentini, D. Villarroel-Lamb, M. Moisan, Y. De la Torre
Date de sortie 2022
Date de sortie 2022
Paralia - XVIIèmes Journées Nationales Génie Côtier – Génie Civil, Chatou
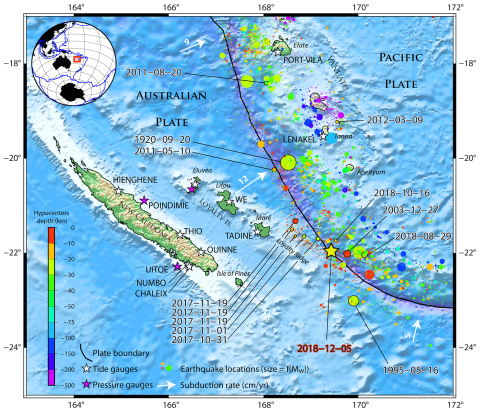
The Mw 7.5 Tadine (Maré, Loyalty Islands) earthquake and related tsunami of 5 December 2018: seismotectonic context and numerical modeling
On 5 December 2018, a magnitude Mw 7.5 earthquake occurred southeast of Maré, an island of the Loyalty Islands archipelago, New Caledonia. This earthquake is located at the junction between the plunging Loyalty Ridge and the southern part of the Vanuatu Arc, in a tectonically complex and very active area regularly subjected to strong seismic crises and earthquakes higher than magnitude 7 and up to 8.
J. Roger, B. Pelletier, M. Duphil, J. Lefèvre, J. Aucan, P. Lebellegard, B. Thomas, C. Bachelier, D. Varillon
Date de sortie 21/11/2021
Date de sortie 21/11/2021
NHESS, volume 21
Predicting Storm Surges
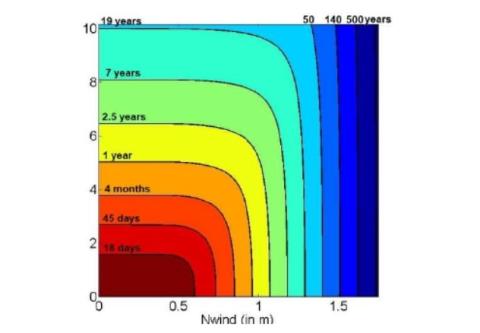
In this chapter, we present a second example of statistical estimation of extreme quantiles: millennial quantiles for storm surges at Brest (France), based on hourly sea-level measurements. We run sensitivity tests on parameter values, on the choice of analytic models for distributions, and on the statistical estimation methods chosen. Uncertainty in estimates and associated confidence intervals are also calculated and compared.
M. Andreewsky
Date de sortie 10/10/2021
Date de sortie 10/10/2021
Extreme Value Theory with Applications to Natural Hazards, pp345-359, Springer, Cham

Wave overtopping and overflow hazards: application on the Camargue sea-dike
Dike breaches occurs regularly during storm events. This phenomenon contributes to amplify considerably the impact of floods on coastal areas. It represents an important cost for repairing existing infrastructures in the vicinity of the sea-dike. Then, they must be upgraded to prevent breaches. In the present study, ANEMOC and REFMAR dataset were analysed, off Camargue coasts, to quantify the storm hazards in terms of wave height and sea level wind setup. Repartition laws were adjusted on dataset to build a 2D-copula which is used to estimate events return periods.
T. Paul, C. Lutringer, A. Poupardin, A. Bennabi, J. Jeaong, P. Sergent
Date de sortie 10/2021
Date de sortie 10/2021
Conf. TUC 2020, BE, Antwerp
Improving storm surge and wave forecasts from regional to nearshore scales
Submersion risks assessment requires different tools and methods from regional to coastal scales. The Shom’s strategy relies on numerical modelling and observational systems applied in a challenging multi-scale context. At regional scales, storm surge and wave models Hycom and Wavewatch III, bathymetric digital terrain models (DTMs) and observational tide/buoy networks used within the operational national storm surge service (Homonim project with Météo-France) are presented, as well as their applications in climatological 40-year hindasts.
A. Pasquet, H. Michaud, L. Seyfried, R. Baraille, L. Biscara, Y. Krien, D. Jourdan
Date de sortie 05/2021
Date de sortie 05/2021
9ᵗʰ EuroGOOS Conference, Virtual Edition
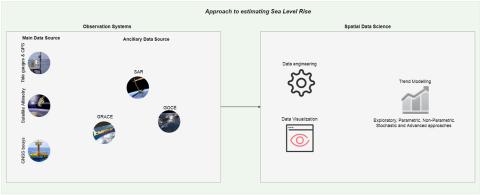
Advances in estimating Sea Level Rise: A review of tide gauge, satellite altimetry and spatial data science approaches
Significant developments have been made in the observation systems and techniques of estimating sea level towards meeting the standard accuracy requirement of Global Climate Observation Systems (GCOS). This study undertakes a systematic review of the current advances in estimating sea level change in the context of the 4th industrial revolution. Trends in the use of main observation systems such as tide gauges, satellite altimetry, and ancillary systems such as GNSS and Autonomous Surface Vehicles were explored.
N. Adebisi, A.-L. Balogun, T. Hee Min, A. Tella
Date de sortie 01/04/2021
Date de sortie 01/04/2021
Ocean & Coastal Management, volume 208