Filtrer les publications
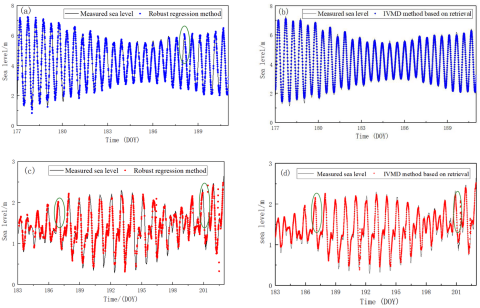
Multi-GNSS Combination Multipath Reflectometry Based on IVMD Method for Sea Level Retrieval
Sea level monitoring is particularly important in coastal areas that are vulnerable to marine disasters. It was recently demonstrated that the global navigation satellite system multipath reflectometry (GNSS-MR) technique, which uses multipath signals reflected from the sea, can be applied to determine the sea level. However, this approach does not provide sufficient accuracy or equally spaced sampling to meet the actual sea level monitoring requirements for certain stations.
R. Li, Y. Wen, X. Wang, H. Xu
Date de sortie 23/03/2023
Date de sortie 23/03/2023
Remote Sensing
Water-level changes and subsidence rates along the East Sea coastline of the Saigon-Dong Nai River Estuary and the Mekong Delta
Southeast Asian deltas are highly threatened areas for flooding as a response to the combined effects of natural compaction and subsidence exacerbated by human impacts, e.g. oil, gas and water extraction, retention of sediment discharge due to river damming and sand mining, land use changes, sea-level rise and storm-induced water-level setup. Tide-induced water-level fluctuations on different time- and spatial scales, seasonal variations of freshwater runoff and sea-level setup can amplify the impact of sea-level rise and of storm surges on the coastal environment and its inhabitants.
T. C. Nguyen, K. Schwarzer, K. Ricklefs
Date de sortie 16/02/2023
Date de sortie 16/02/2023
Estuarine, Coastal and Shelf Science, volume 283
Impact of an exceptional winter flood on benthic oxygen and nutrient fluxes in a temperate macrotidal estuary: Potential consequences on summer deoxygenation
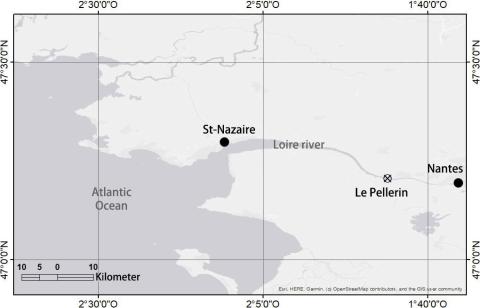
Despite 20 years of control on eutrophication, episodes of summer hypoxia still occur in the Loire estuary, impacting water quality and posing a key scientific and management challenge. This work aimed to quantify the contribution of the benthic compartment to hypoxia in the Loire estuary by direct measurement of water–sediment fluxes and an in-depth understanding of the seasonal variations of oxides and phosphorus stocks.
V. Hulot, E. Metzger, A. Thibault de Chanvalon, A. Mouret, S. Schmidt, B. Deflandre, S. Rigaud, E. Beneteau, N. Savoye, P. Souchu, Y. Le Merrer, G. M. Maillet
Date de sortie 10/02/2023
Date de sortie 10/02/2023
Frontiers in Marine Science
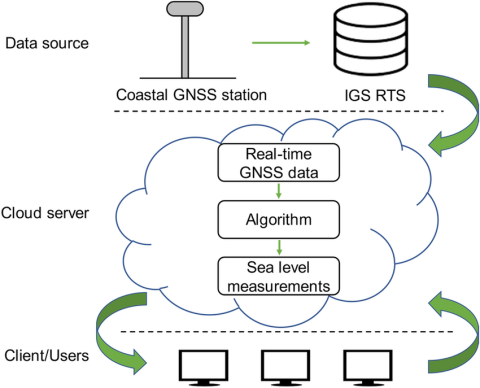
Cloud-based near real-time sea level monitoring using GNSS reflectometry
In addition to traditional tide gauges, the ground-based global navigation satellite system reflectometry (GNSS-R) that utilizes signal-to-noise ratio data from a single GNSS receiver has become another promising alternative for sea level monitoring. However, its application is limited by retrieval precision, especially in large tidal variation environments. On the other hand, previous studies have focused on performance improvement by using post-processing strategies, which cannot support practical (near-) real-time applications.
Z. Liu, L. Du, P. Zhou, X. Wang, Z. Zhang, Z. Liu
Date de sortie 05/02/2023
Date de sortie 05/02/2023
GPS Solutions, volume 27, article 65
Sea level changes: the data available at the PSMSL and SONEL and the results of satellite altimetry
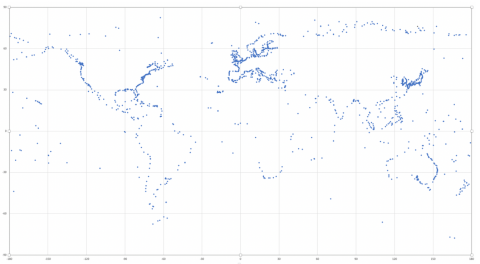
Sea level changes are a complex and quite discussed topic in the media, mostly because of their relationship with “climate change”. The first instruments to evaluate sea level changes are the Tide Gauges (TG) that began to register data in 1700, at Amsterdam. The TG registrations are validated and homogenized, to be comparable, by PSMSL (Permanent Service for Mean Sea Level). The longest record is the one in Brest (France) that begins in 1807. They register the Relative Sea Level (RSL). In fact, the data show that the vertical movements on the continent strongly affect the RSL curves.
M. A. Araújo
Date de sortie 20/12/2022
Date de sortie 20/12/2022
Research Square - Preprint
Data rescue process in the context of sea level reconstructions: An overview of the methodology, lessons learned, up-to-date best practices and recommendations
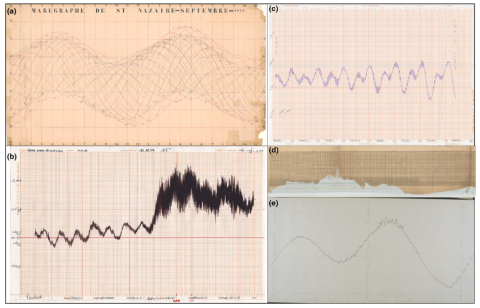
Coastal water level measurements represent one of the earliest geophysical measurements and allow an assessment of historical sea level rise and trends in tides, river flow and storm surge. However, recovery and digitization of archival tidal records have been much less widespread and systematic than, for example meteorological records. In this contribution, we discuss data rescue efforts and lessons learned in France, the United States and the United Kingdom, countries with early and extensive tide gauge networks by the mid-19th century.
A. Latapy, Y. Ferret, L. Testut, S. Talke, T. Aarup, F. Pons, G. Jan, E. Bradshaw, N. Pouvreau
Date de sortie 14/12/2022
Date de sortie 14/12/2022
Geoscience Data Journal, volume 10
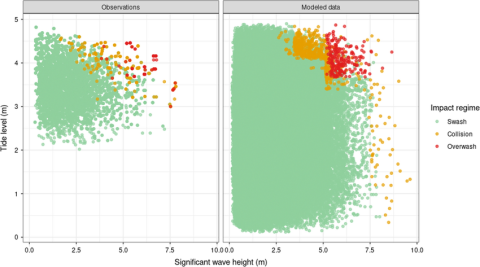
Bayesian networks to predict storm impact using data from both monitoring networks and statistical learning methods
Bayesian networks are probabilistic graphical models that are increasingly used to translate hydraulic boundary conditions during storm events into onshore hazards. However, comprehensive databases that are representative of the extreme and episodic nature of storms are needed to train the Bayesian networks. Such databases do not exist for many sites and many Bayesian networks are trained on data generated by process-based models. To our knowledge, they have not been trained exclusively on observational data for storm impact modeling.
A. Callens, D. Morichon, B. Liquet
Date de sortie 26/09/2022
Date de sortie 26/09/2022
Natural Hazards, volume 115
A database for sea-level monitoring in French Polynesia
This article presents a curated database of the sea-level measurements acquired by the network of the five geodetic tide gauges managed over French Polynesia by the Geodesy Observatory of Tahiti from 13 June 2009 to 28 January 2021.
J.-P. Barriot, F. Zhang, B. Ducarme, G. Wöppelmann, G. André, A. Gabillon
Date de sortie 05/09/2022
Date de sortie 05/09/2022
Geoscience Data Journal, volume 10

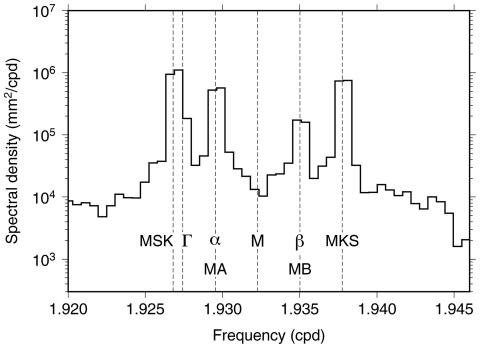
Technical note: On seasonal variability of the M₂ tide
Seasonal variability of the M₂ ocean tide can be detected at many ports, perhaps most. Examination of the cluster of tidal constituents residing within the M₂ tidal group can shed light on the physical mechanisms underlying seasonality. In the broadest terms these are astronomical, frictional–advective interactions, and climate processes; some induce annual modulations and some semiannual, in amplitude, phase, or both. This note reviews how this occurs and gives an example from each broad category.
R. D. Ray
Date de sortie 19/07/2022
Date de sortie 19/07/2022
Ocean Science, volume 18