16 years of topographic surveys of rip-channelled high-energy meso-macrotidal sandy beach
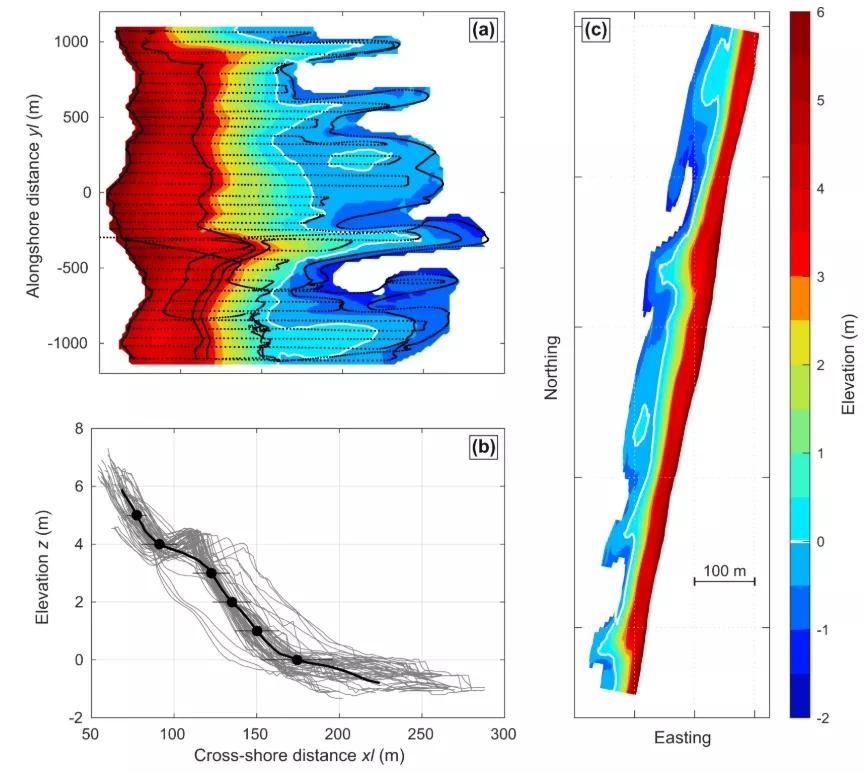
Sandy beaches are highly dynamic environments buffering shores from storm waves and providing outstanding recreational services. Long-term beach monitoring programs are critical to test and improve shoreline, beach morphodynamics and storm impact models. However, these programs are relatively rare and mostly restricted to microtidal alongshore-uniform beaches. The present 16-year dataset contains 326 digital elevation models and their over 1.635 × 10⁶ individual sand level measurements at the high-energy meso-macrotidal rip-channelled Truc Vert beach, southwest France. Monthly to bimonthly topographic surveys, which coverage progressively extended from 300 m to over 2000 m to describe the alongshore-variable changes, are completed by daily topographic surveys acquired during a 5-week field campaign. The dataset captures daily beach response at the scale of a storm to three large cycles of interannual variability, through the impact of the most energetic winter since at least 75 years and prominent seasonal erosion/recovery cycles. The data set is supplemented with high-frequency time series of offshore wave and astronomical tide data to facilitate its future use in beach research.
B. Castelle, S. Bujan, V. Marieu, S. Ferreira
- Scientific Data 7, article 410
Date de sortie 20/11/2020


