Hourly sea level height forecast based on GNSS-IR by using ARIMA model
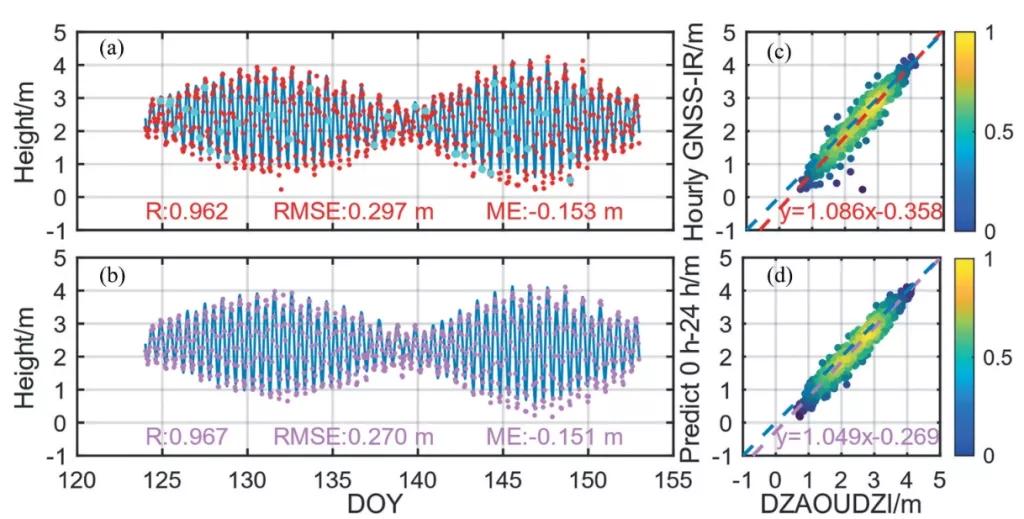
Multi-satellite and Multi-Signal-to-Noise Ratio (SNR) types provide more basic data for the monitoring of sea level height by Global Navigation Satellite System Interferometric Reflectometry (GNSS-IR) technology. Few studies predict sea level height with high temporal resolution. This study proposes a theory based on GNSS-IR technology and Auto Regressive Integrated Moving Average (ARIMA) model. Taking the MAYG station as an example, the process of sea level height prediction and the determination of the best prediction scheme are shown. First, the sea level height monitored by the GNSS-IR technology is averaged hour by hour as the sea level height at the instantaneous moment. A linear interpolation method is used to compensate for the missing sea level time series. Then, the number of days to participate in the prediction of GNSS-IR sea level height and its forecast are selected for the experiment of predicting tide level. In the tide level prediction study from DOY125 to DOY153, the results of predicting the future 24 h, 48 h, and 72 h from one tide level period (29 days) illustrate that the accuracy of predicting the sea level height at 24 h is the best (R: 0.967, RMSE: 0.270 m, ME: −0.151 m), and the predicted tide level is highly consistent with the tide level measured at the tide gauge station. In addition, experiments reveal that the prediction accuracy gradually decreases with the increase of prediction time. This study verifies the feasibility of the hour-by-hour sea level prediction theory combined with the GNSS-IR technology and the ARIMA model. It proves that the theory can carry out continuous prediction of sea level, further promoting the breakthrough and transformation of GNSS-IR technology to the application level.
N. Zheng, H. Chai, Y. Ma, L. Chen, P. Chen
- International Journal of Remote Sensing, volume 43
Date de sortie 27/06/2022


