Water Level Modulation of Wave Transformation, Setup and Runup Over La Saline Fringing Reef
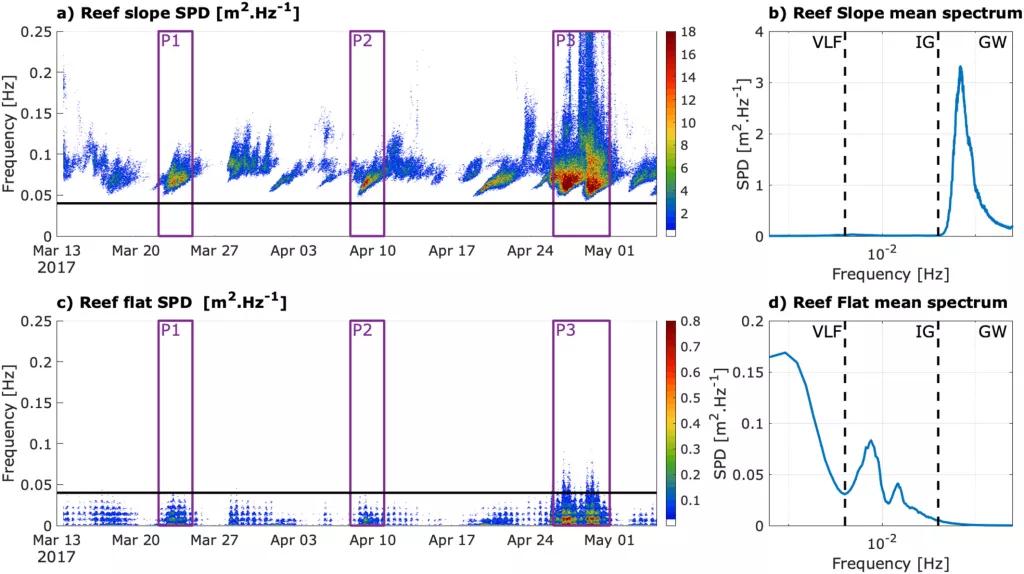
Coral reefs represent an efficient natural mechanical coastal defense against ocean waves. The focus of this study is La Saline fringing coral reef, located in the microtidal West of La Réunion Island in the Indian Ocean, frequently exposed to Southern Ocean swell and cyclonic events. The aim is to provide a better understanding of the reef's coastal defense characteristics for several Southern Ocean swell events. Pressure sensors were placed across the reef to measure water level fluctuations and to study wave transformation. A numerical model (XBeach surfbeat), validated using field observations, was used to deepen understanding of wave transformation, wave setup and runup. Field measurements and model outputs show that as gravity waves dissipate over the reef, and frequency-dependent dissipation of infragravity waves by bottom-friction occurs, the reef acts as a low-pass filter. Wave-induced setup is found to be the dominant hydrodynamic component. Setup and runup are each 98% and 79% driven by the offshore significant wave height, and 2% and 21% driven by the tide. The modulation of the water level by setup is the main contributor to runup in the fringing reef. At semidiurnal timescales, setup and runup are in antiphase with tidal variations as lower water levels result in higher gravity wave energy dissipation, setup and runup. Simple-to-use transfer functions relating incident wave characteristics to these hydrodynamic components are proposed. The effects of bottom friction and water level on the defensive capacity of the coral reef highlight future implications of structural damage and sea level rise.
W. Bruch, E. Cordier, F. Floc'h, S. G. Pearson
- JGR Oceans, volume 127
Date de sortie 25/06/2022


