Filtrer les publications
Temporal scales of variability in Regions Of Freshwater Influence on the French continental shelf over two decades
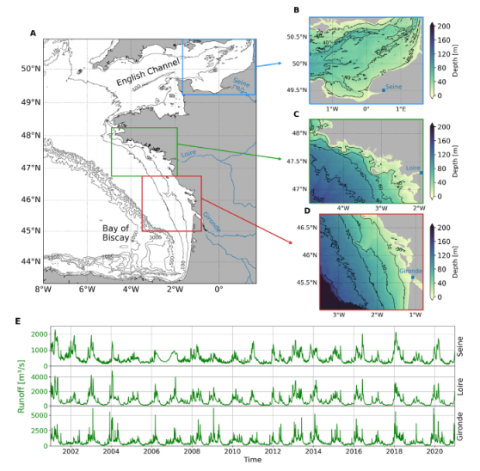
The Regions Of Freshwater Influence (ROFIs) are defined as the area on the continental shelf in the vicinity of estuaries, where freshwater from the river significantly influence water properties and circulation. These regions are subject to a variety of dynamic forcings, including tides, winds and river runoffs, which exhibit considerable variability. The objective of this study is to identify the dominant time scales of variability of the three major ROFIs (Seine, Loire, and Gironde) of the French continental shelf and their evolution over the last two decades.
Maud Martinez Almoyna, Guillaume Charria, Marc Sourisseau, Anne Gaymard, Xavier Couvelard, Sébastien Theetten, Jean-François Le Roux
Date de sortie 10/05/2025
Date de sortie 10/05/2025
Journal of Marine Systems
Aquatic food webs in restored marshes: a stable-isotope approach in the Gironde estuary (SW France)
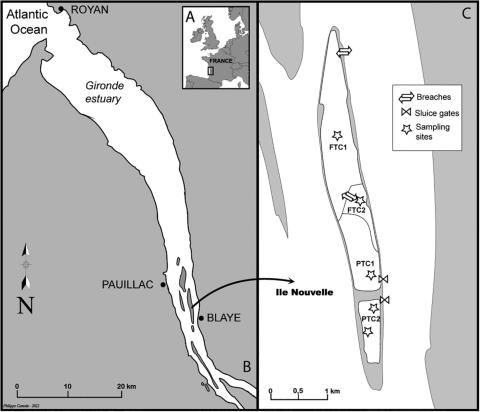
Intertidal marshes are important habitats for nekton. However, historical draining and dyking hampered European coastal wetlands. Marsh restoration is therefore critical not only to improve their capacity to protect coastal lines but also to rehabilitate their ecological functionalities. The benefits of intertidal marsh restoration for nekton community composition and feeding ecology are examined in a case study within the largest macrotidal estuary in Western Europe (Gironde).
Laure Carassou, Maud Vildier, Jeremy Lobry, Benoit Lebreton, Nicolas Savoye, Mireia Kohler, Stéphane Bons, Mario Lepage, Hugues Blanchet, Henrique Cabral
Date de sortie 21/04/2025
Date de sortie 21/04/2025
Restoration ecology
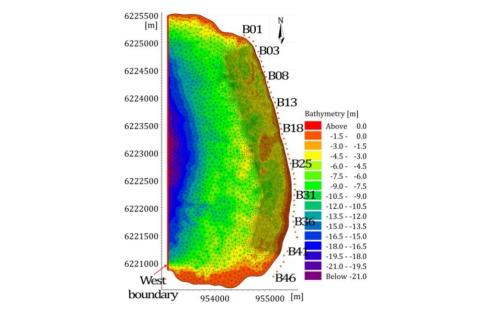
Investigating the effects of sea-level rise on morphodynamics in the western Giens tombolo, France
Rising sea level along with the occurrence of greater and more frequent storms would cause not only coastal flooding, but also beach erosion and shoreline retreat problems. The Almanarre beach along the western Giens tombolo is socio-economically and heavily vulnerable to accelerated sea level rise due to its high touristic value and low-lying topography. Therefore, it is necessary to quantify the impacts of sea level rise (SLR) on the morphodynamics in this area, e.g. to evaluate the relationship between the beach erosion and SLR.
M. T. Vu, Y. Lacroix, V. T. Nguyen
Date de sortie 2025
Date de sortie 2025
IOP Conference Series: Earth and Environmental Science, volume 67 (ICESE 2018)
Influence of biofouling on the mooring tension of the COAST-HF Iroise monitoring buoy
The COAST-HF_Marel-Iroise station is a scientific floating platform in the Ifremer in situ test site of Sainte Anne du Portzic equipped with various sensors to monitor the local metocean conditions (Trasch Martin, 2023). It provides a rich array of input data for field campaign on mooring line tension of this station, both with and without the presence of biofouling.
N. Russo, M.Träsch, K. Mehring, V. Perier, M. Répécaud
Date de sortie 12/2024
Date de sortie 12/2024
Ifremer - Brief by IUML n°6, OCEANEXT 2024
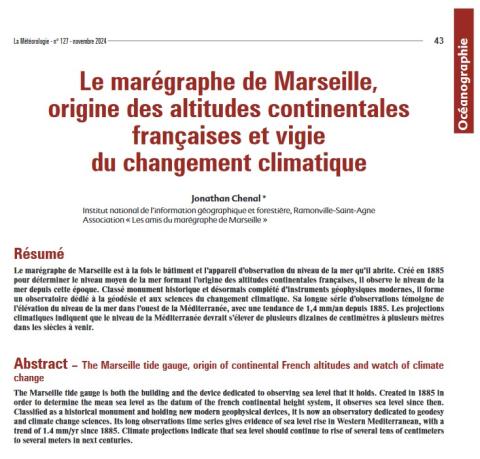
Le marégraphe de Marseille, origine des altitudes continentales françaises et vigie du changement climatique
Le marégraphe de Marseille est à la fois le bâtiment et l'appareil d'observation du niveau de la mer qu'il abrite. Créé en 1885 pour déterminer le niveau moyen de la mer formant l'origine des altitudes continentales françaises, il observe le niveau de la mer depuis cette époque. Classé monument historique et désormais complété d'instruments géophysiques modernes, il forme un observatoire dédié à la géodésie et aux sciences du changement climatique.
Jonathan Chenal
Date de sortie 01/11/2024
Date de sortie 01/11/2024
La Météorologie, 127, 43-49, 2024
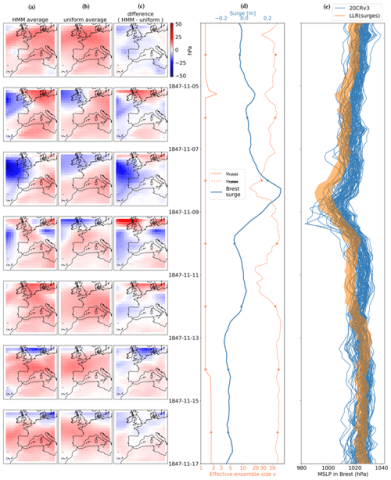
Could old tide gauges help estimate past atmospheric variability?
The storm surge is the non-tidal component of coastal sea-level. It responds to the atmosphere both through the direct effect of atmospheric pressure on the sea-surface, and through Ekman transport induced by wind-stress. Tide gauges have been used to measure the sea-level in coastal cities for centuries, with many records dating back to the 19th-century or even further, at times when direct pressure observations were scarce.
P. Platzer, P. Tandeo, P. Ailliot, B. Chapron
Date de sortie 10/10/2024
Date de sortie 10/10/2024
EGU
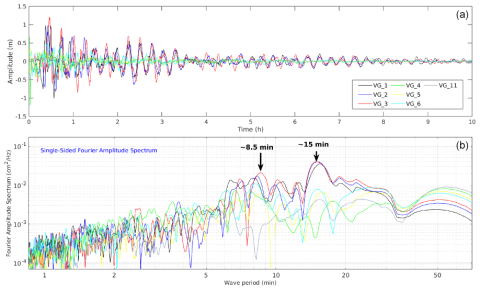
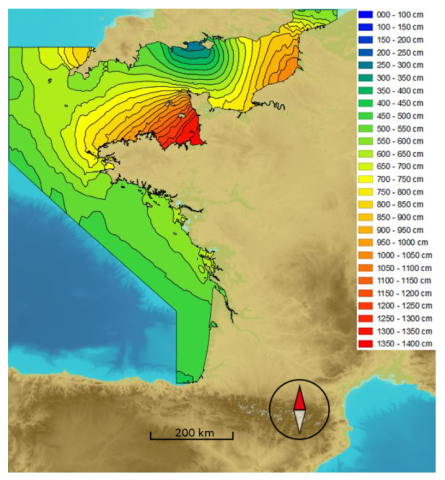
Forearc crustal faults as tsunami sources in the upper plate of the Lesser Antilles subduction zone: the case study of the Morne Piton fault system
In this study, alternatively to the megathrust, we identify upper-plate normal faults orthogonal to the trench as a possible tsunami source along the Lesser Antilles subduction zone. The Morne Piton fault system is such a trench-perpendicular upper crustal fault at the latitude of Guadeloupe.
M. Philippon, J. Roger, J.-F. Lebrun, I. Thinon, O. Foix, S. Mazzotti, M.-A. Gutscher, L. Montheil, J.-J. Cornée
Date de sortie 19/09/2024
Date de sortie 19/09/2024
NHESS
A systemic and comprehensive assessment of coastal hazard changes: method and application to France and its overseas territories
In the context of climate change, height and frequency variations in extreme sea levels (ESLs) are studied using deterministic and probabilistic approaches. However, this type of approach does not highlight the dynamic effects (waves, currents) generated by metocean events (storms, cyclones, long swells, and tsunamis) beyond their effects on sea levels. In particular, ESL estimates are calculated by considering the main determining physical factors but cannot include all the effects of these factors. Ultimately, this can lead to confusion between ESL and hazard.
M. Igigabel, M. Yates, M. Vousdoukas, Y. Diab
Date de sortie 12/06/2024
Date de sortie 12/06/2024
NHESS
A composite approach to document a century of overwash events in a high tide environment of southern Brittany, France
Understanding and precisely dating the sedimentological imprint of storm-induced back-barrier washover deposits is challenging, even more so in macro-tidal environments. Indeed, in such a situation, significant storms may not lead to any washover deposits, for instance if they occurred during low tide. To tackle this challenge, we propose a method based on crossing sedimentology, historical impacts from archives and weather-marine data, together with dating, statistics and modeling technique.
P. Pouzet, D. Idier
Date de sortie 11/01/2024
Date de sortie 11/01/2024
Estuarine, Coastal and Shelf Science, volume 298